167 solar installations with 5.5 MWp of capacity are installed in Le Noirmont.
Go to the communityRoof potential
The suitable roofs of Le Noirmont could deliver around 24 GWh of solar power a year. An estimated ~23% of it is used today.
A local electricity community is collecting sign-ups here. The more neighbours join, the sooner it starts.
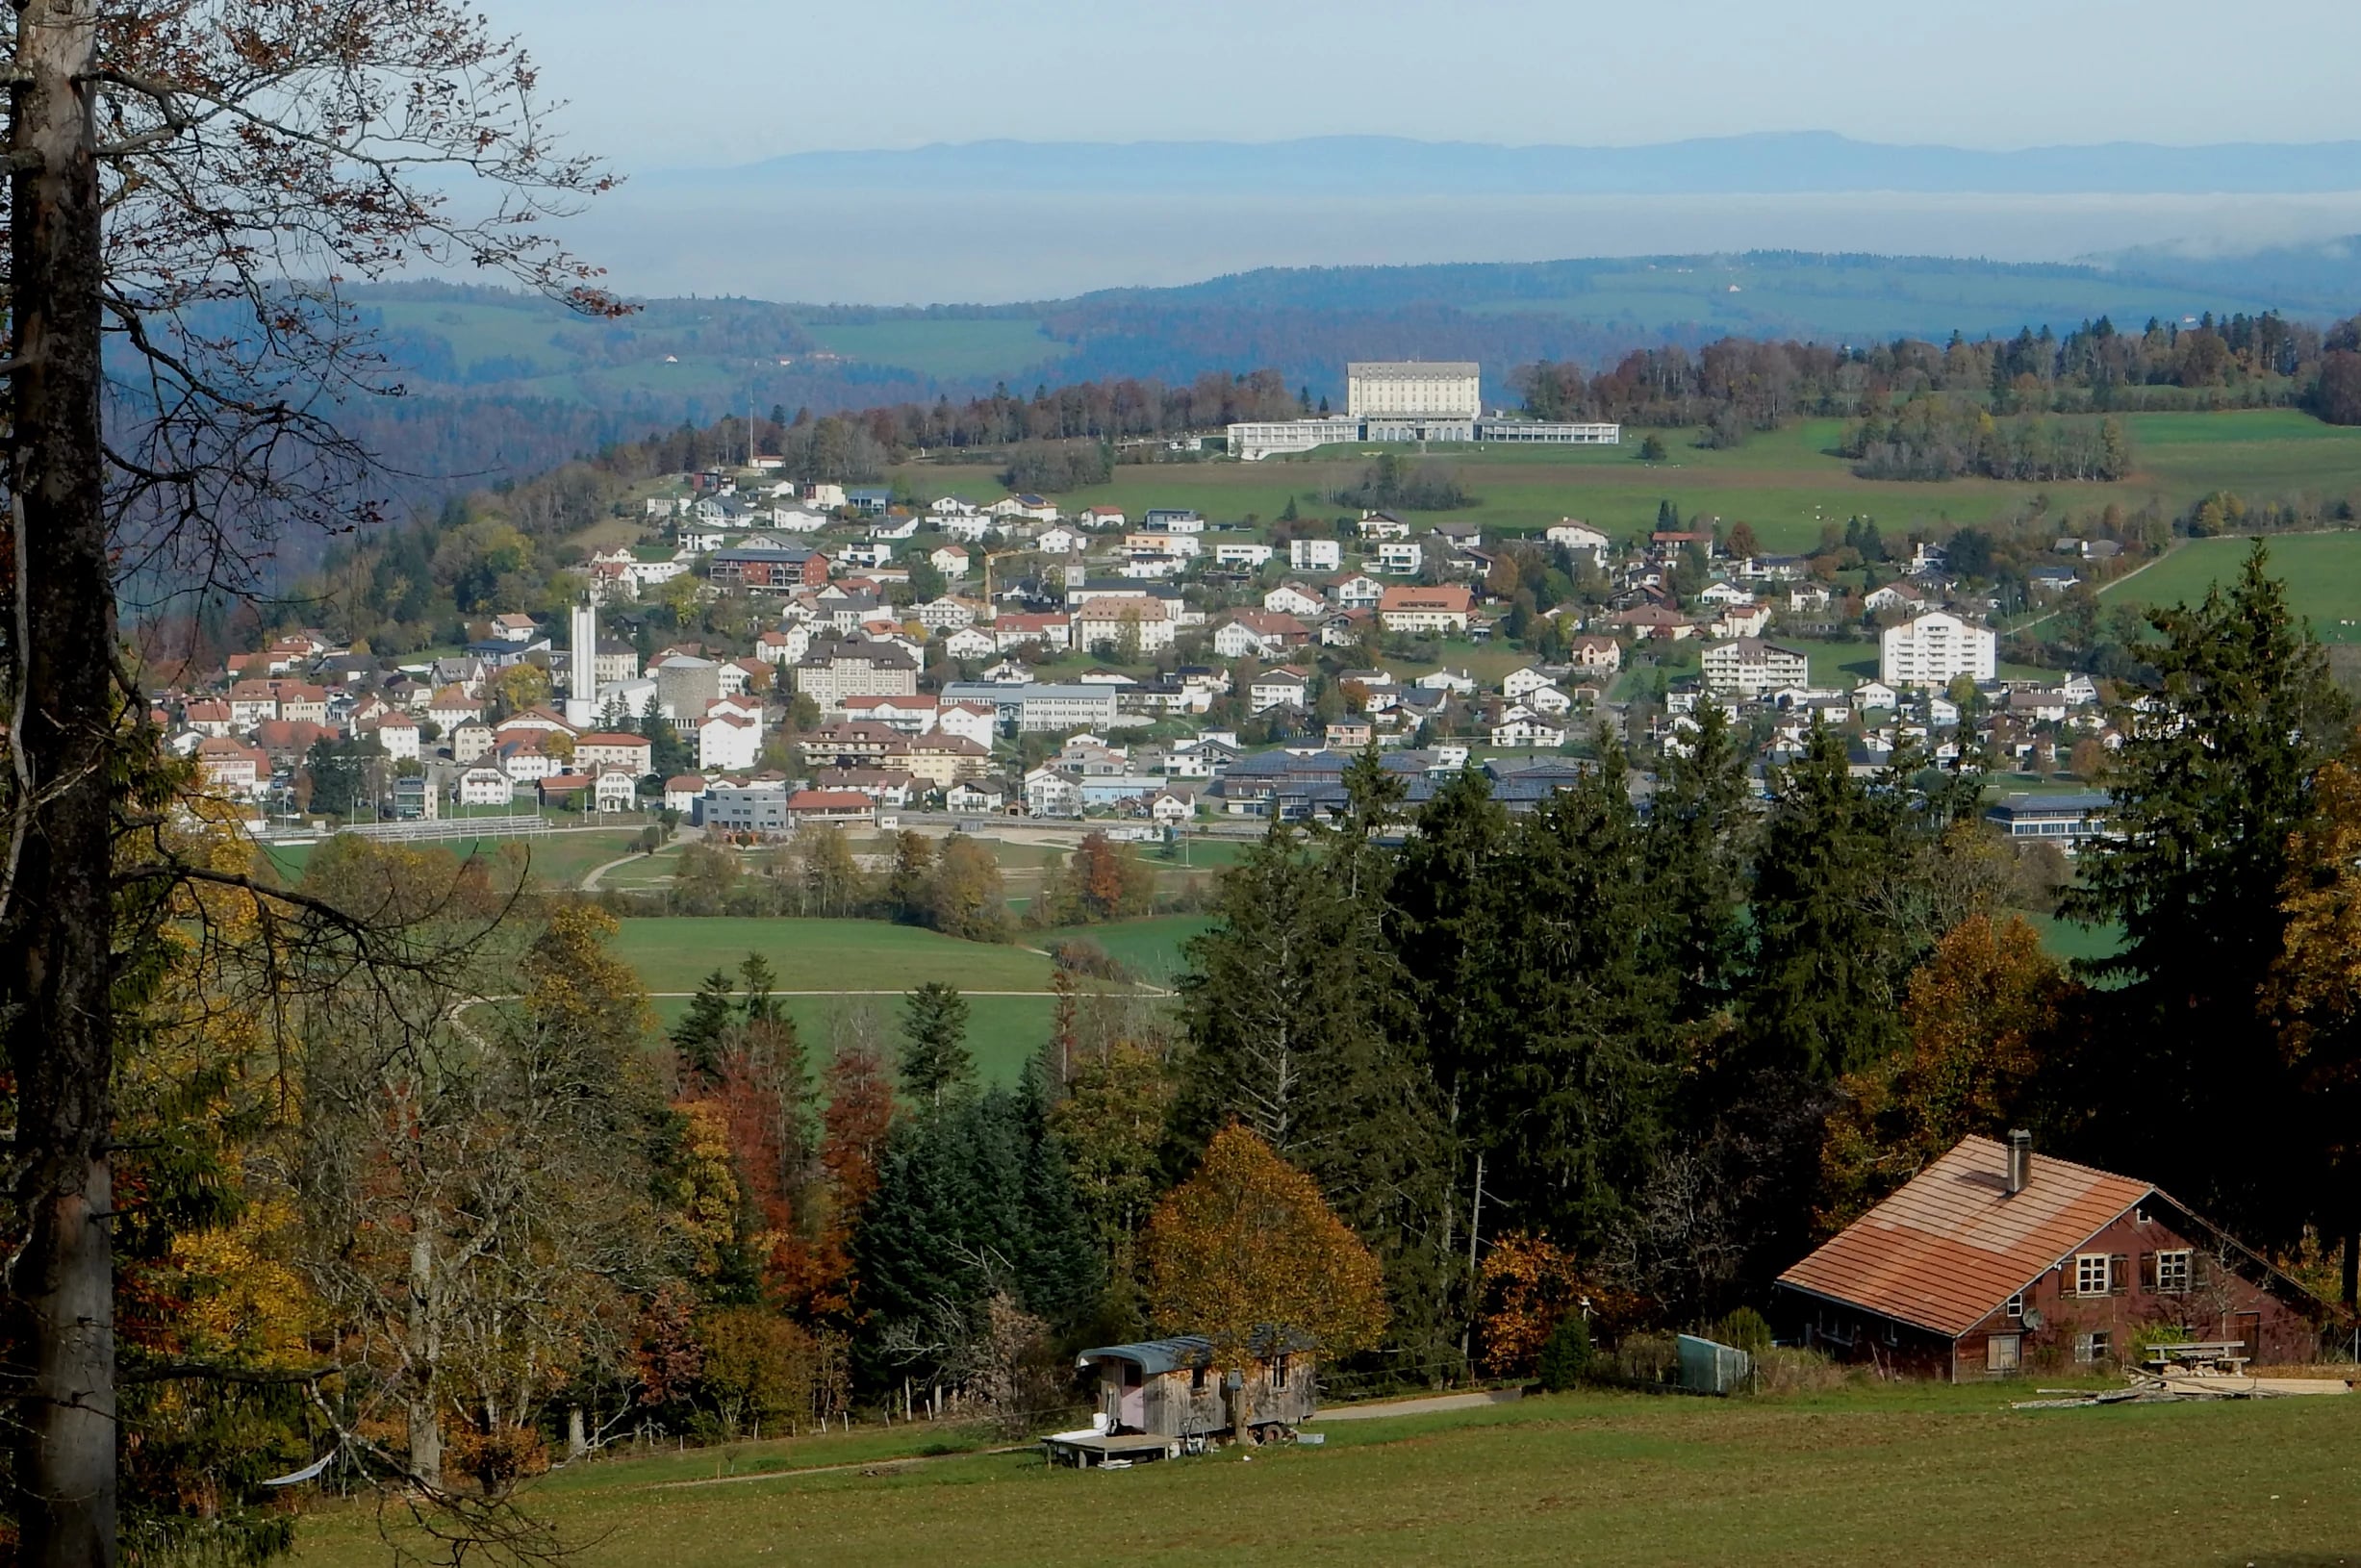
Le Noirmont, JU
Muriaux, JU
Les Bois, JU
La Chaux-des-Breuleux, JU
Get solar power from your neighbourhood. Joining is free and you keep your electricity supplier.
Sources: Swiss Federal Office of Energy (SFOE), swisstopo, opendata.swiss. As of October 2026. Totals per municipality only, no individual installations.
| Build year | Installations | Capacity (kWp) |
|---|---|---|
| before 2012 | 4 | 252 |
| 2012 | 3 | 324 |
| 2013 | 6 | 659 |
| 2014 | 1 | 196 |
| 2015 | 4 | 64 |
| 2016 | 4 | 357 |
| 2017 | 10 | 85 |
| 2018 | 9 | 262 |
| 2019 | 6 | 45 |
| 2020 | 15 | 185 |
| 2021 | 8 | 79 |
| 2022 | 15 | 432 |
| 2023 | 33 | 1’609 |
| 2024 | 34 | 427 |
| 2025 | 14 | 323 |
| 2026 | 1 | 180 |
5.2 MWp have been added since 2012.
| Month | GWh |
|---|---|
| Jan | 0.9 |
| Feb | 1.3 |
| Mar | 2.1 |
| Apr | 2.5 |
| May | 2.8 |
| Jun | 3.2 |
| Jul | 3.3 |
| Aug | 2.7 |
| Sept | 2.1 |
| Oct | 1.5 |
| Nov | 0.9 |
| Dec | 0.7 |
